name: inverse class: center, middle, inverse layout: true .header[.floatleft[.teal[Christopher Biggs] — Continuous Dashboarding].floatright[.teal[@unixbigot] .logo[@accelerando_au]]] .footer[.floatleft[ #AgileAus Jun 2017]] --- layout: true .header[.floatleft[.teal[Christopher Biggs] — Continuous Dashboarding].floatright[.teal[@unixbigot] .logo[@accelerando_au]]] .footer[.floatleft[ #AgileAus Jun 2017]] --- class: center, middle template: inverse # Continuous Dashboarding .green[How and Why to apply Agile methods to Business Intelligence.]  .bottom.right[ .teal[Christopher Biggs], .logo[Accelerando Consulting] <br>.teal[@unixbigot] .logo[@accelerando_au] ] --- .left-column[ # Agenda ] .right-column[ ### **Strategy**: * .pink[**Why**] should you build dashboards? * .red[**Who**] are your dashboards for? * .orange[**What**] to monitor * .yellow[**When**] to build your dashboards ### **Tactics**: * .green[**How**] to develop dashboards * .blue[**Where**] to fit dashboards into your DevOps pipeline * .purple[**With**] some suggested tools ] --- class: center, middle template: inverse # Why? ## Agile is about .pink[more] than code ### Dashboarding helps you .pink[learn] about your .yellow[product], and .green[customers]. --- .left-column[ #Strategy ## Why ] .right-column.arrow.vtight[ ## Why build dashboards? #### A little thing called the Scientific Method (Bacon et.al, 1620-) #### Time and Motion (Taylor, 1911) #### How We Think (Dewey, 1933) #### Plan Do Check Act (Deming/Shewhart Cycle, 1950s) #### SMART - Specific, Measurable, Achievable, Relevant, Time-Bound (Drucker, 1954) #### Observe, Orient, Decide, Act (Boyd, 1976) #### The Agile Manifesto (Agile Alliance (.orange[i.e. us!]), 2001) #### "SMARTER" - SMART + Evaluate, Review (Yemm, 2013) #### The only difference between .red[failing] and .green[learning] is .purple[measuring] * (Me, ripping off .blue[@donttrythis], just now) ] --- .left-column[ #Strategy ## Why ] .right-column.arrow[ ## Education: (n) The process of discovering your own ignorance. #### You don't know what customers want. * Customers don't know what they want, either. * Companies don't know what their customers want. * Companies might not even know what their product is! #### How to pretend to have read "The Lean Startup" * Part 1: Define, Learn, Experiment * Part 2: Test, Measure, Pivot ] --- .left-column[ #Strategy ## Why ] .right-column.arrow[ ## Validated learning - how to know if we achived our goal #### Ask (Interrogate) the customer #### Form an Intelligence (spy) Agency #### Let's call it "Business Intelligence" (BI) ] --- class: center, middle template: inverse # Who? ## Dashboards and Business Intelligence (BI) are .red[Product] ### Think about who are the .green[customers] of your BI --- .left-column[ #Strategy ## Why ## Who ] .right-column.autodim.vtight[  ## Who is your BI for? #### Analysis and summaries targeted at marketing * Long term trends * "Bottom line" numbers #### Detailed dashboards are traditionally targeted at ops. * Measure **all** the things! * Wake me if it's on **fire** * Little feedback goes back **upstream** ] --- .left-column[ #Strategy ## Why ## Who ] .right-column.autodim[ ## Who are your dashboards for? #### Traditionally targeted at ops, but #### DevOps is a thing. * Development is a different **point of view** * **Instrument** your applications * Measure **trends** and **levels** in your KPIs * Look for **out-of-range** metrics * What does normal **look** like? * Regression-test your **bottom line** ] --- .left-column[ #Strategy ## Why ## Who ] .right-column.autodim[ ## Who are your dashboards for? #### Traditionally targeted at ops, but #### DevOps is a thing #### Support and Sales need to know everything's OK, too * Is the first time you know of problems when support escalates? * Do support call ops and ask "Is everything OK, we're getting a lot of calls"? * "Well Mrs Arbuckle, I see other customers are having problems too" ] --- .left-column[ #Strategy ## Why ## Who ] .right-column.autodim[ ## Who are your dashboards for? #### Traditionally targeted at ops, but #### DevOps is a thing #### Support and Sales need to know everything's OK too #### Management want reassurance (and to know you deliver) * The morning report for "How long till my next **Porsche**" * Shipped a great new feature? You now have a **hotline** to the CEOs eyeballs. ] --- .left-column[ #Strategy ## Why ## Who ] .right-column.autodim[ ## Who are your dashboards for? #### Traditionally targeted at ops, but #### DevOps is a thing #### Support and Sales need to know everything's OK too #### Management want reassurance (and to know you deliver) #### Customers (do you dare?) * What are you **ashamed** of them seeing? * What could you **do** about that? ] --- .left-column[ #Strategy ## Why ## Who ] .right-column.autodim[ ## Give **customers** a weather report  #### Take notice of load spikes * "We are processing your order. This hour that takes around 25 seconds but could be up to two minutes" ] --- .left-column[ #Strategy ## Why ## Who ] .right-column.autodim[ ## Give **customers** a weather report #### Take notice of load spikes #### Respond to temporary outages * "Sorry, it looks like PayPal has been experiencing high error rates for the last 15 minutes. May we suggest you try AliPay or Credit Card?" * This could head off a flood of support calls or bad reviews ] --- .left-column[ #Strategy ## Why ## Who ] .right-column.autodim[ ## Give **customers** a weather report #### Take notice of load spikes #### Respond to temporary outages #### Assure customers that errors are being acted on * "We're sorry, this page experienced a problem. Bug #3342 has already been forwarded to our Dev Team. You'll get an email when it's fixed, or check our .fakelink[change log]" * again, turn your failures into goodwill ] --- .left-column[ #Strategy ## Why ## Who ] .right-column.autodim[ ## What's relevant to this **support** call? #### Notice recent errors affecting this customer * "Mr Lee encountered .fakelink[Bug #3342] six minutes ago" ] --- .left-column[ #Strategy ## Why ## Who ] .right-column.autodim[ ## What's relevant to this **support** call? #### Notice recent errors affecting this customer #### Notice recent outages affecting this customer * "Currently experiencing elevated transaction declines for Westpac cards" ] --- .left-column[ #Strategy ## Why ## Who ] .right-column.autodim[ ## What's relevant to this **support** call? #### Notice recent errors affecting this customer #### Notice recent outages affecting this customer #### Remember recent behaviour of this customer * "Dr Patel had her password reset yesterday, and presented her old password three times today" ] --- class: center, middle template: inverse # What? ## Not just **things**, also .green[patterns] and .red[trends] --- .left-column[ #Strategy ## Why ## Who ## What ] .right-column.autodim[  ## What should I be monitoring? #### Traditionally - **Things** * system load indicators * rates of key events (pageloads, signups, checkouts etc.) * service status * error alerts ("pages") ] --- .left-column[ #Strategy ## Why ## Who ## What ] .right-column.autodim[ ## What should I be monitoring? .fig50[ ] #### Traditionally - **Things** #### Now - **Patterns** and **Trends** * Business Goals - Rates plus Trends ] --- .left-column[ #Strategy ## Why ## Who ## What ] .right-column.autodim[  ## What should I be monitoring? #### Traditionally - **Things** #### Now - **Patterns** and **Trends** * Business Goals - Rates plus Trends * Unavoidable errors - look for out-of-range levels ] --- .left-column[ #Strategy ## Why ## Who ## What ] .right-column.autodim[ .fig50[ ] ## What should I be monitoring? #### Traditionally - **Things** #### Now - **Patterns** and **Trends** * Business Goals - Rates plus Trends * Unavoidable errors - look for out-of-range levels * Location and traffic patterns ] --- .left-column[ #Strategy ## Why ## Who ## What ] .right-column.autodim[ ## What should I be monitoring?  #### Traditionally - **Things** #### Now - **Patterns** and **Trends** * Business Goals - Rates plus Trends * Unavoidable errors - look for out-of-range levels * Location and traffic patterns * User Experience metrics ] --- .left-column[ #Strategy ## Why ## Who ## What ] .right-column.autodim[  ## What should I be monitoring? #### Traditionally - **Things** #### Now - **Patterns** and **Trends** * Business Goals - Rates plus Trends * Unavoidable errors - look for out-of-range levels * Location and traffic patterns * User Experience metrics * Health of your third-party interfaces ] --- .left-column[ #Strategy ## Why ## Who ## What ] .right-column.autodim[ ## What should I be monitoring? .fig50[ ] #### Traditionally - **Things** #### Now - **Patterns** and **Trends** * Business Goals - Rates plus Trends * Unavoidable errors - look for out-of-range levels * Location and traffic patterns * User Experience metrics * Health of your third-party interfaces * App and product reviews (iTunes, Google, Yelp, Amazon...) ] --- .left-column[ #Strategy ## Why ## Who ## What ] .right-column.autodim[ .fig50[ ] ## What should I be monitoring? #### Traditionally - **Things** #### Now - **Patterns** and **Trends** * Business Goals - Rates plus Trends * Unavoidable errors - look for out-of-range levels * Location and traffic patterns * User Experience metrics * Health of your third-party interfaces * App and product reviews (iTunes, Google, Yelp, Amazon...) * Social media (facebook, twitter, et.al.) ] --- class: center, middle template: inverse # When? ## Make Business Intelligence part of your .orange[**DevOps**] processes --- .left-column[ #Strategy ## Why ## Who ## What ## When ] .right-column.autodim.tight[ ## When should I build dashboards? .fig50[ ] #### Early and Often! * Dashboards inform your planning and strategy * Make sure you *really* know the status quo before you code ] --- .left-column[ #Strategy ## Why ## Who ## What ## When ] .right-column.autodim.tight[ ## When should I build dashboards? .fig50[ ] #### Early and Often! #### Continuously * Dashboards are (subjective) tests * **Hopefully** you already run tests before you ship * Think about what tests you should run **continuously** ] --- .left-column[ #Strategy ## Why ## Who ## What ## When ] .right-column.autodim.tight[ ## When should I build dashboards? #### Early and Often! #### Continously: Dashboards are (subjective) tests .fig50[ 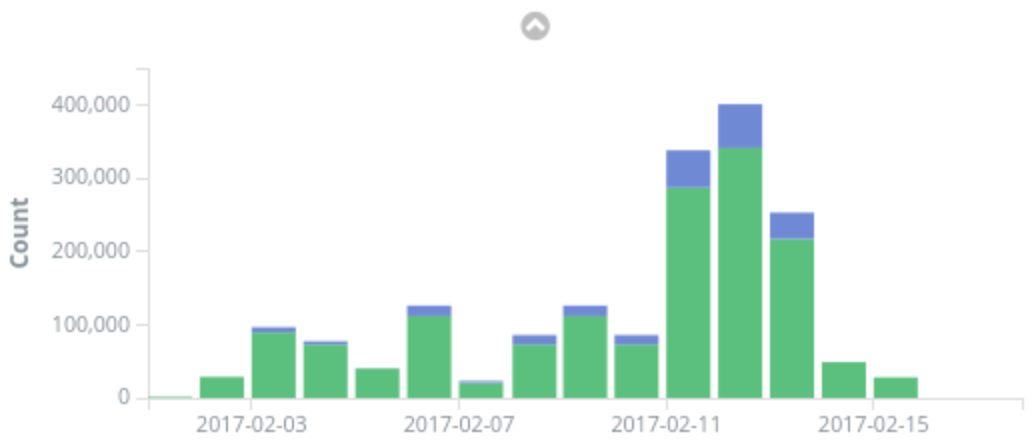] #### Releases: Dashboards are longitudinal tests * How does this release compare to last release? ] --- .left-column[ #Strategy ## Why ## Who ## What ## When ] .right-column.autodim.tight[ 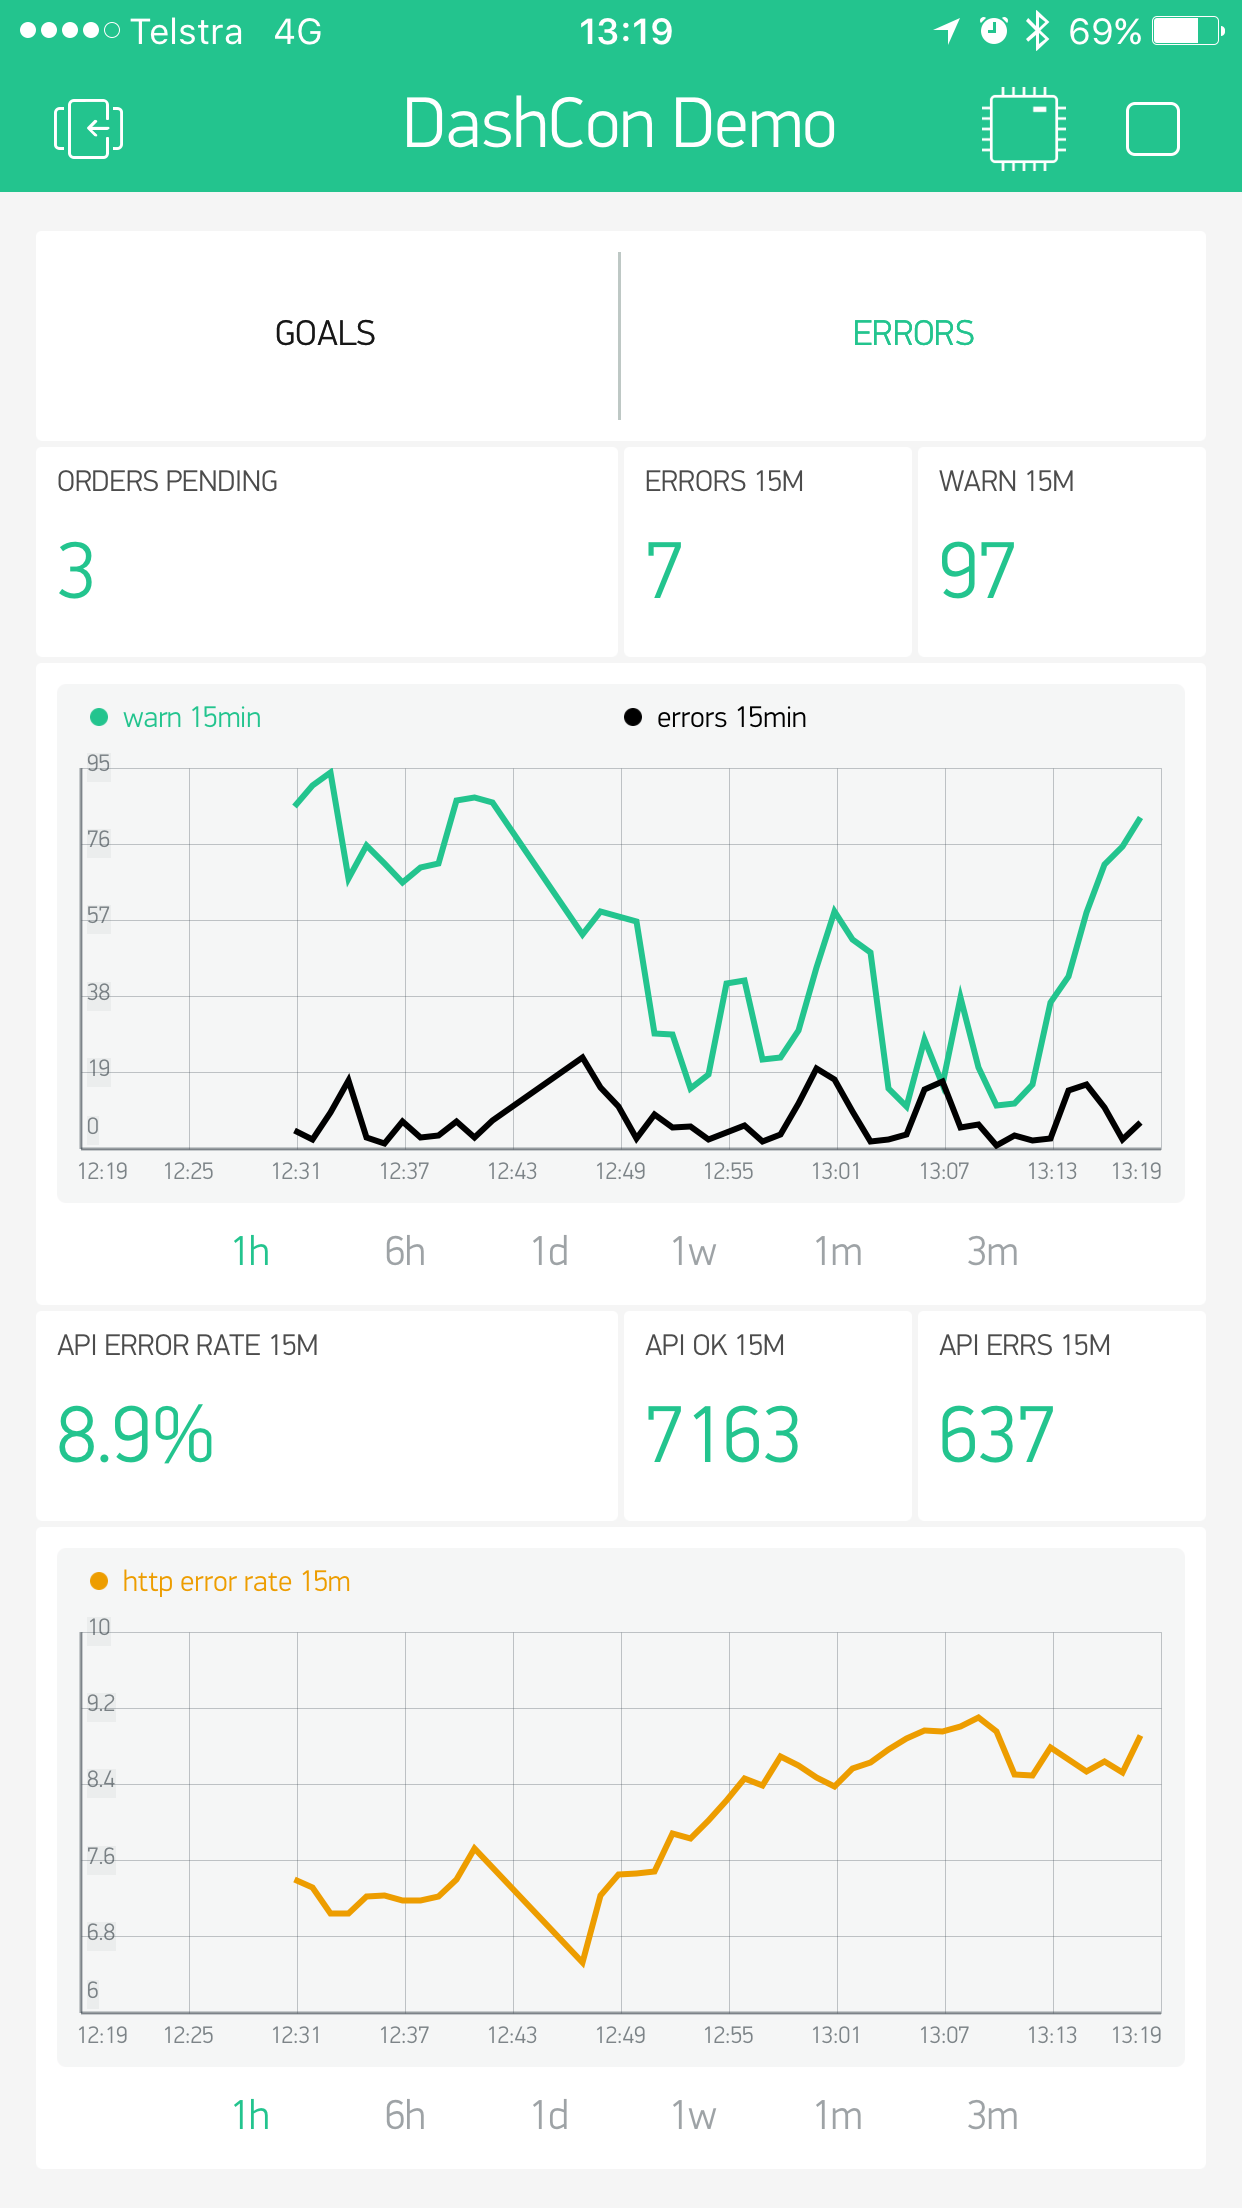 ## When should I build dashboards? #### Early and Often! #### Continuously: Dashboards are (subjective) tests #### Releases: Dashboards are longitudinal tests #### Fridays: Dashboards are your DevOps "airbag" * Is the bucket still under the money waterfall? * Is it Friday? Does that scare you? ] --- .left-column[ #Strategy ## Why ## Who ## What ## When ] .right-column.autodim.tight[ ## When should I build dashboards? .fig40[ 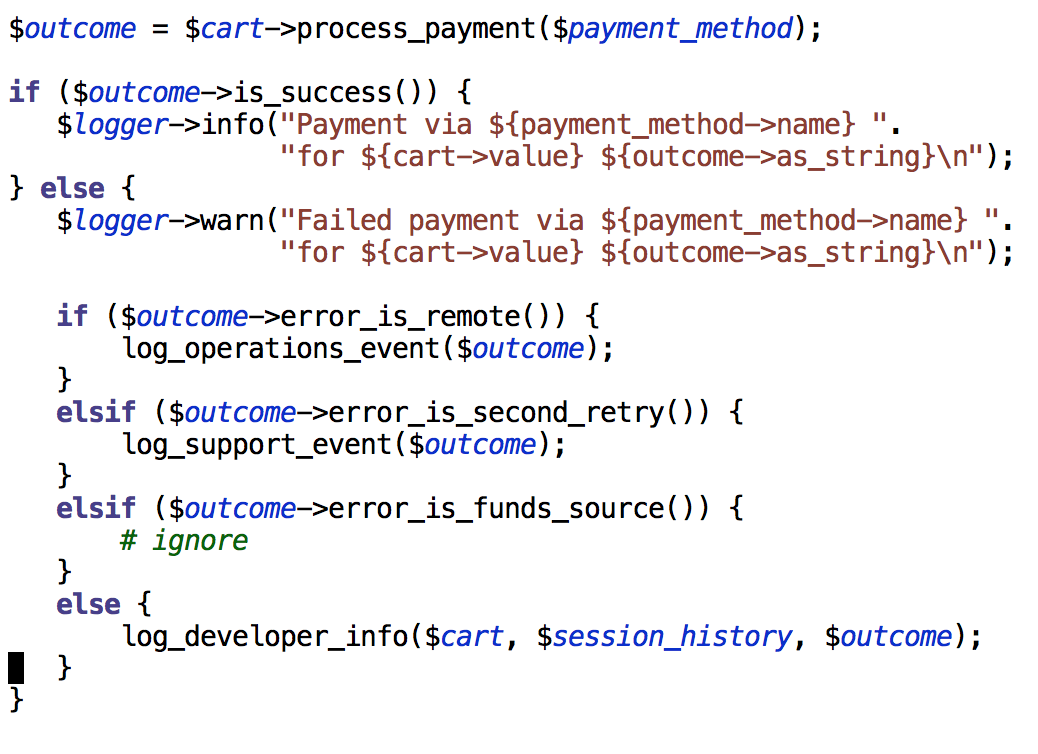] #### Early and Often! #### Continuously: Dashboards are (subjective) tests #### Releases: Dashboards are longitudinal tests #### Fridays: Dashboards are your DevOps "airbag" #### Coding: Dashboards help you think about Features holistically * Who needs to know about this new feature? Training? * What other parts of our ecosystem will this affect? ] --- .left-column[ #Strategy ## Why ## Who ## What ## When ] .right-column.autodim.vtight[ ## When should I build dashboards? .fig40[ 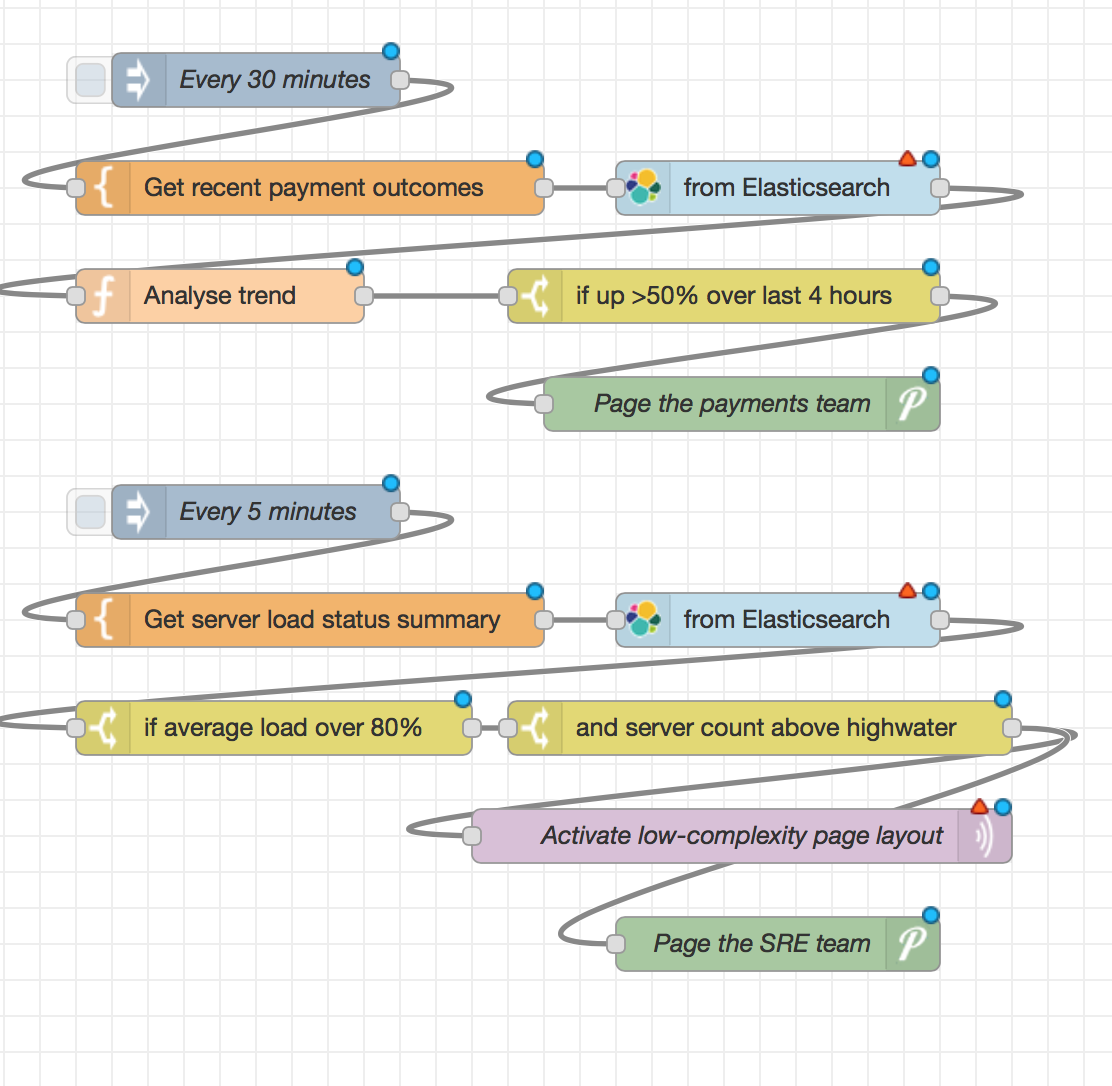] #### Early and Often! #### Continuously: Dashboards are (subjective) tests #### Releases: Dashboards are longitudinal tests #### Fridays: Dashboards are your DevOps "airbag" #### Coding: Dashboards help you think about Features holistically #### During test: Dashboards help you plan for adverse outcomes * **Validate** your assumptions * What do I **do** if this breaks? * Who will notice a failure? Who needs to be **notified**? ] --- class: center, middle template: inverse # How? ## Encourage a .purple[**data-loving**] culture --- .left-column[ # Strategy ## Why ## Who ## What ## When # Tactics ## How ] .right-column.bulletsh4[ ## So, How do I get there from here? #### **Experiment** with your data #### **Develop** dashboards alongside features #### **Test** your dashboards #### **Deploy** your BI configuration as build artifacts. ] --- .left-column[ # Strategy ## Why ## Who ## What ## When # Tactics ## How ] .right-column.autodim.tight[ ## So, How do I get there from here? #### **Experiment** with your data * Derive synergy from bringing your silos together * Visual dataflow tools like .red[**Node-RED**] ([nodered.org](http://nodered.org/)) * Rapid dashboard tools like .green[**Blynk**] ([blynk.cc](http://blynk.cc)) * Explore your data with GUI tools like .purple[**Kibana**] ([elastic.co](http://elastic.co/)) .fig30[ .img-320w[]] .fig20[ .img-200h[]] .fig40[ .img-320w[] ] ] --- .left-column[ # Strategy ## Why ## Who ## What ## When # Tactics ## How ] .right-column.autodim[ ## So, How do I get there from here?  #### **Experiment** with your data #### **Develop** dashboards alongside features * Orchestrate your BI stack (Docker, Vagrant, whatever) * Choose tools that produce shippable artifacts * Demonstrate your dashboards as a deliverable ] --- .left-column[ # Strategy ## Why ## Who ## What ## When # Tactics ## How ] .right-column.autodim[ ## So, How do I get there from here? .fig50[ ] #### **Experiment** with your data #### **Develop** dashboards alongside features #### **Test** your dashboards against your code * ...and vice-versa * Dashboards are **Customer-Facing** product. * Trustworthiness is crucial ] --- class: center, middle template: inverse # Where? ## Dashboards as .blue[**code**] --- .left-column[ # Strategy ## Why ## Who ## What ## When # Tactics ## How ## Where ] .right-column.autodim[ ## Inserting dashboards into your development pipeline .fig40[ ] #### Code-review your Dashboards * Pretty-print JSON or XML data files * Take care to normalise formatting and field order * Use Visual diffing tools to highlight layout changes (eg. pdiffy) ] --- .left-column[ # Strategy ## Why ## Who ## What ## When # Tactics ## How ## Where ] .right-column.autodim[ ## Inserting dashboards into your development pipeline #### Code-review your Dashboards .fig40[ 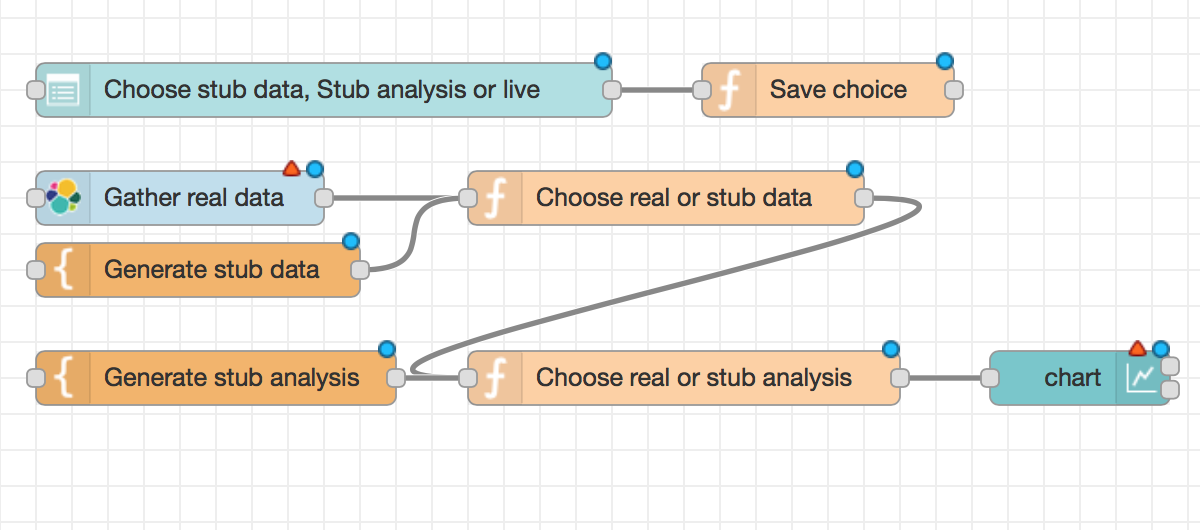] #### Part of your CI test runs * Yes, you can unit-test dashboards * Structure your BI pipeline as Data, Analysis, Display * Add hooks to inject test data * Each stage can be unit-tested with known data * Leverage your integration tests to produce longitudinal data * Use behavioural testing tools to confirm UI outcomes ] --- .left-column[ # Strategy ## Why ## Who ## What ## When # Tactics ## How ## Where ] .right-column.autodim[ ## Inserting dashboards into your development pipeline .fig40[ ] #### Code-review your Dashboards #### Part of your CI test runs #### Performance testing - daily/sprintly test * Build a test that stresses your product to breaking point * Confirm that the right alarms go off * Break things, then verify your ecosystem responds ] --- .left-column[ # Strategy ## Why ## Who ## What ## When # Tactics ## How ## Where ] .right-column.autodim.tight[ ## Inserting dashboards into your development pipeline .fig40[ 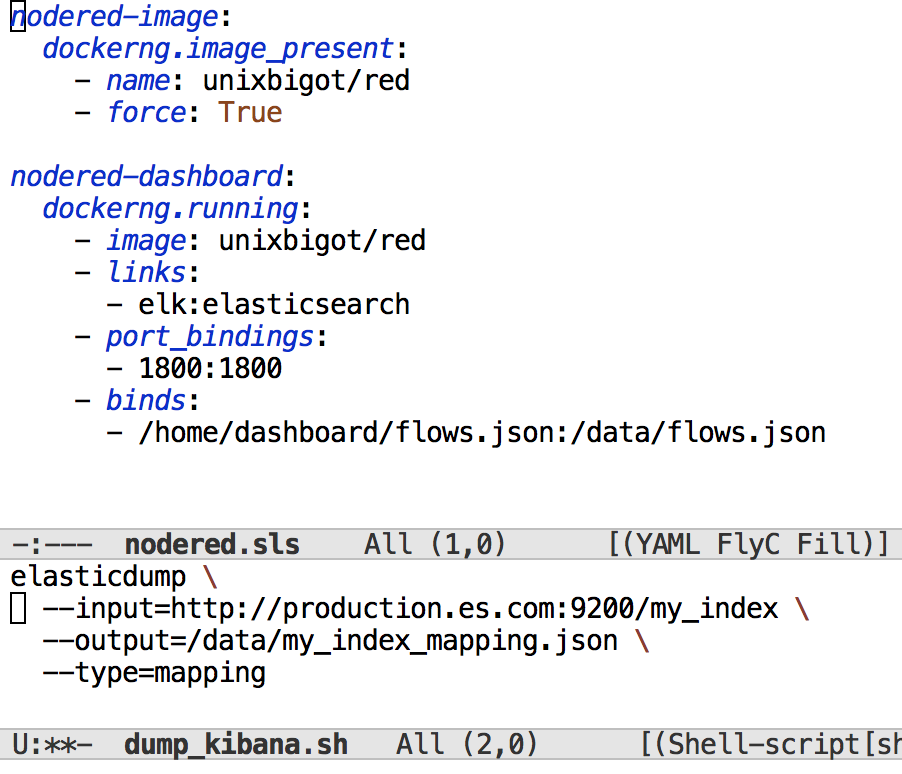] #### Code-review your Dashboards #### Part of your CI test runs #### Performance testing - daily/sprintly test #### Automate deployment - easier with some tools than others * Best case - install configuration files as ordinary artifacts * APIs - pull and push * Database - dump/restore * Web scraping - here be dragons ] --- class: center, middle template: inverse # With ## Case Study: Adding value to .yellow[**Logstash**] with .red[**Node-RED**] and .green[**Blynk**] --- .left-column[ # Strategy ## Why ## Who ## What ## When # Tactics ## How ## Where ## With ] .right-column.vtight[ ## .green[Elasticsearch], .yellow[Logstash], and .purple[Kibana] (ELK) .fig40[ ] * .green[**Elasticsearch**] Fast Distributed NoSQL database * .yellow[**Logstash**] (et.al) Push event streams, application logs, performance data and network stats to an Elasticsearch storage cluster * .purple[**Kibana**] Query, Visualise and Dashboard your data * ELK is Open Source: self-host, AWS, or SaaS * Off-the-shelf docker image suitable for dev, CI, small deployments * Quick interactive querying * Interactively build visulisations and dashboards * Good support for import/export of dashboard components * Weak on certain kinds of analysis and alerting ] --- class: center, middle .fig100[ ] --- .left-column[ # Strategy ## Why ## Who ## What ## When # Tactics ## How ## Where ## With ] .right-column.tight[ ## .red[Node-RED] - A Visual system for Wiring the Internet .fig40[ 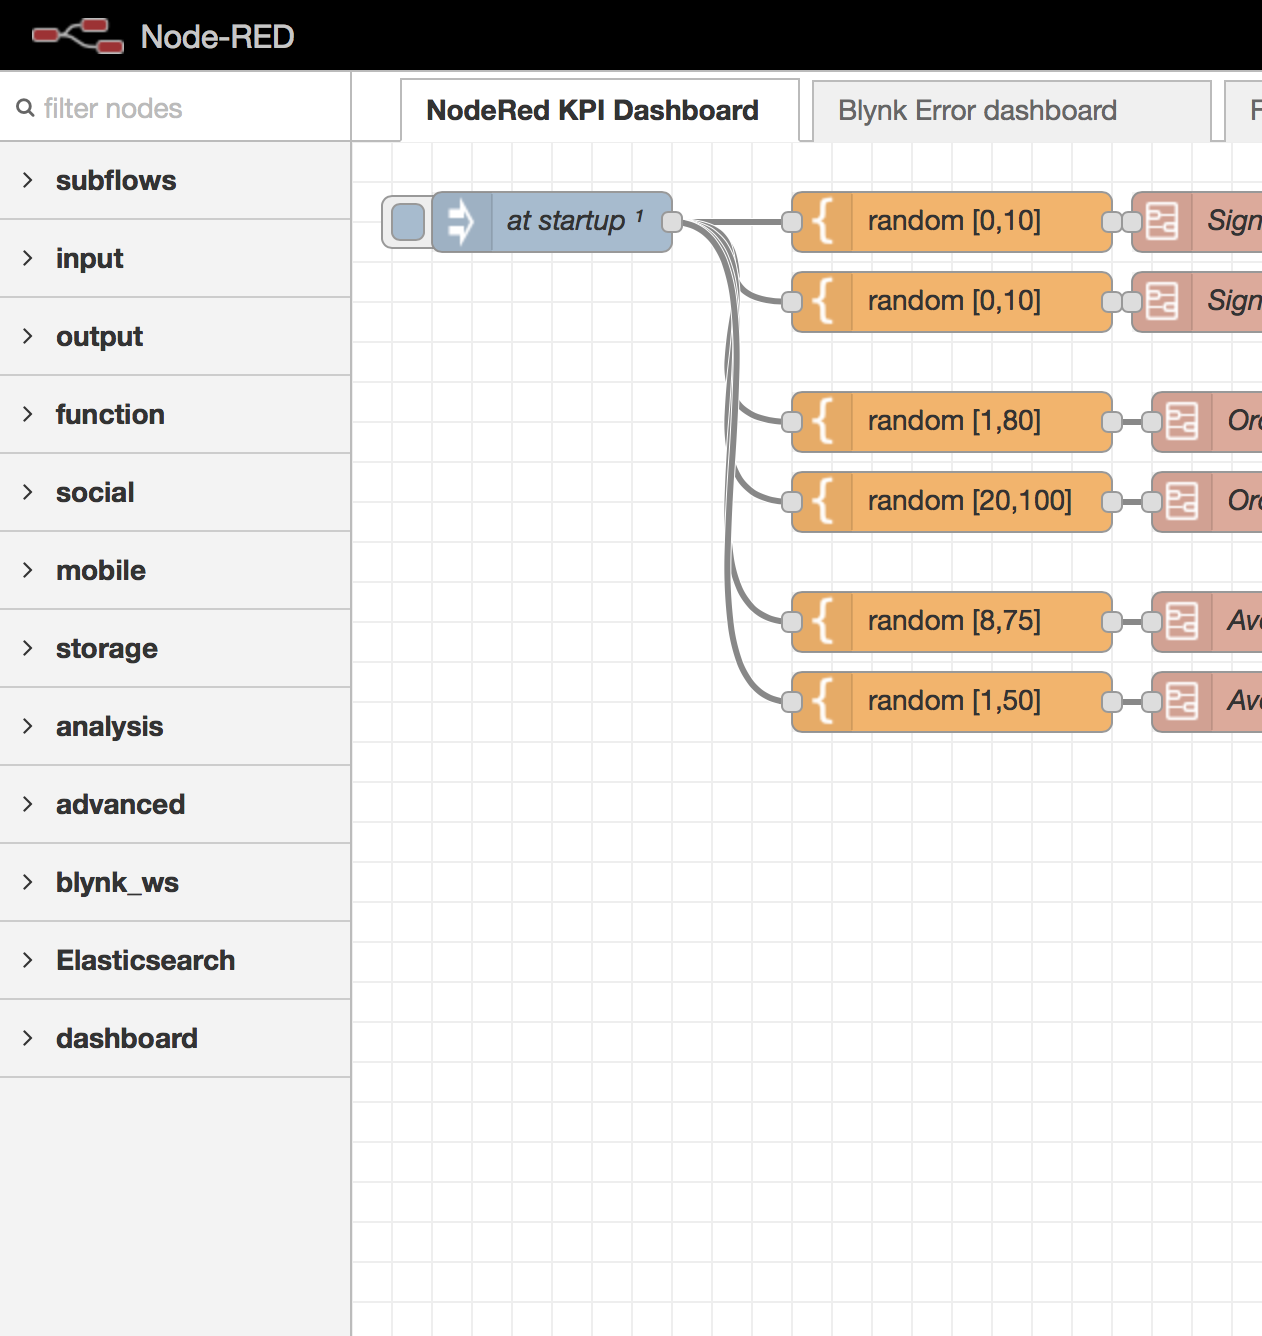] * Open source (Node.js) * Originated at IBM, now under JS Foundation * .red[**Flow**] based data processing - "Fire all the programmers", at last? * Create flows using drag+drop flow editor - `http://nodered.example.com:1800/` * Huge plugin ("node") ecosystem * Integrated dashboarding - `http://nodered.example.com:1800/ui` - or output values to other data stores ] --- ## Business Goal Monitor  .fig60l[ 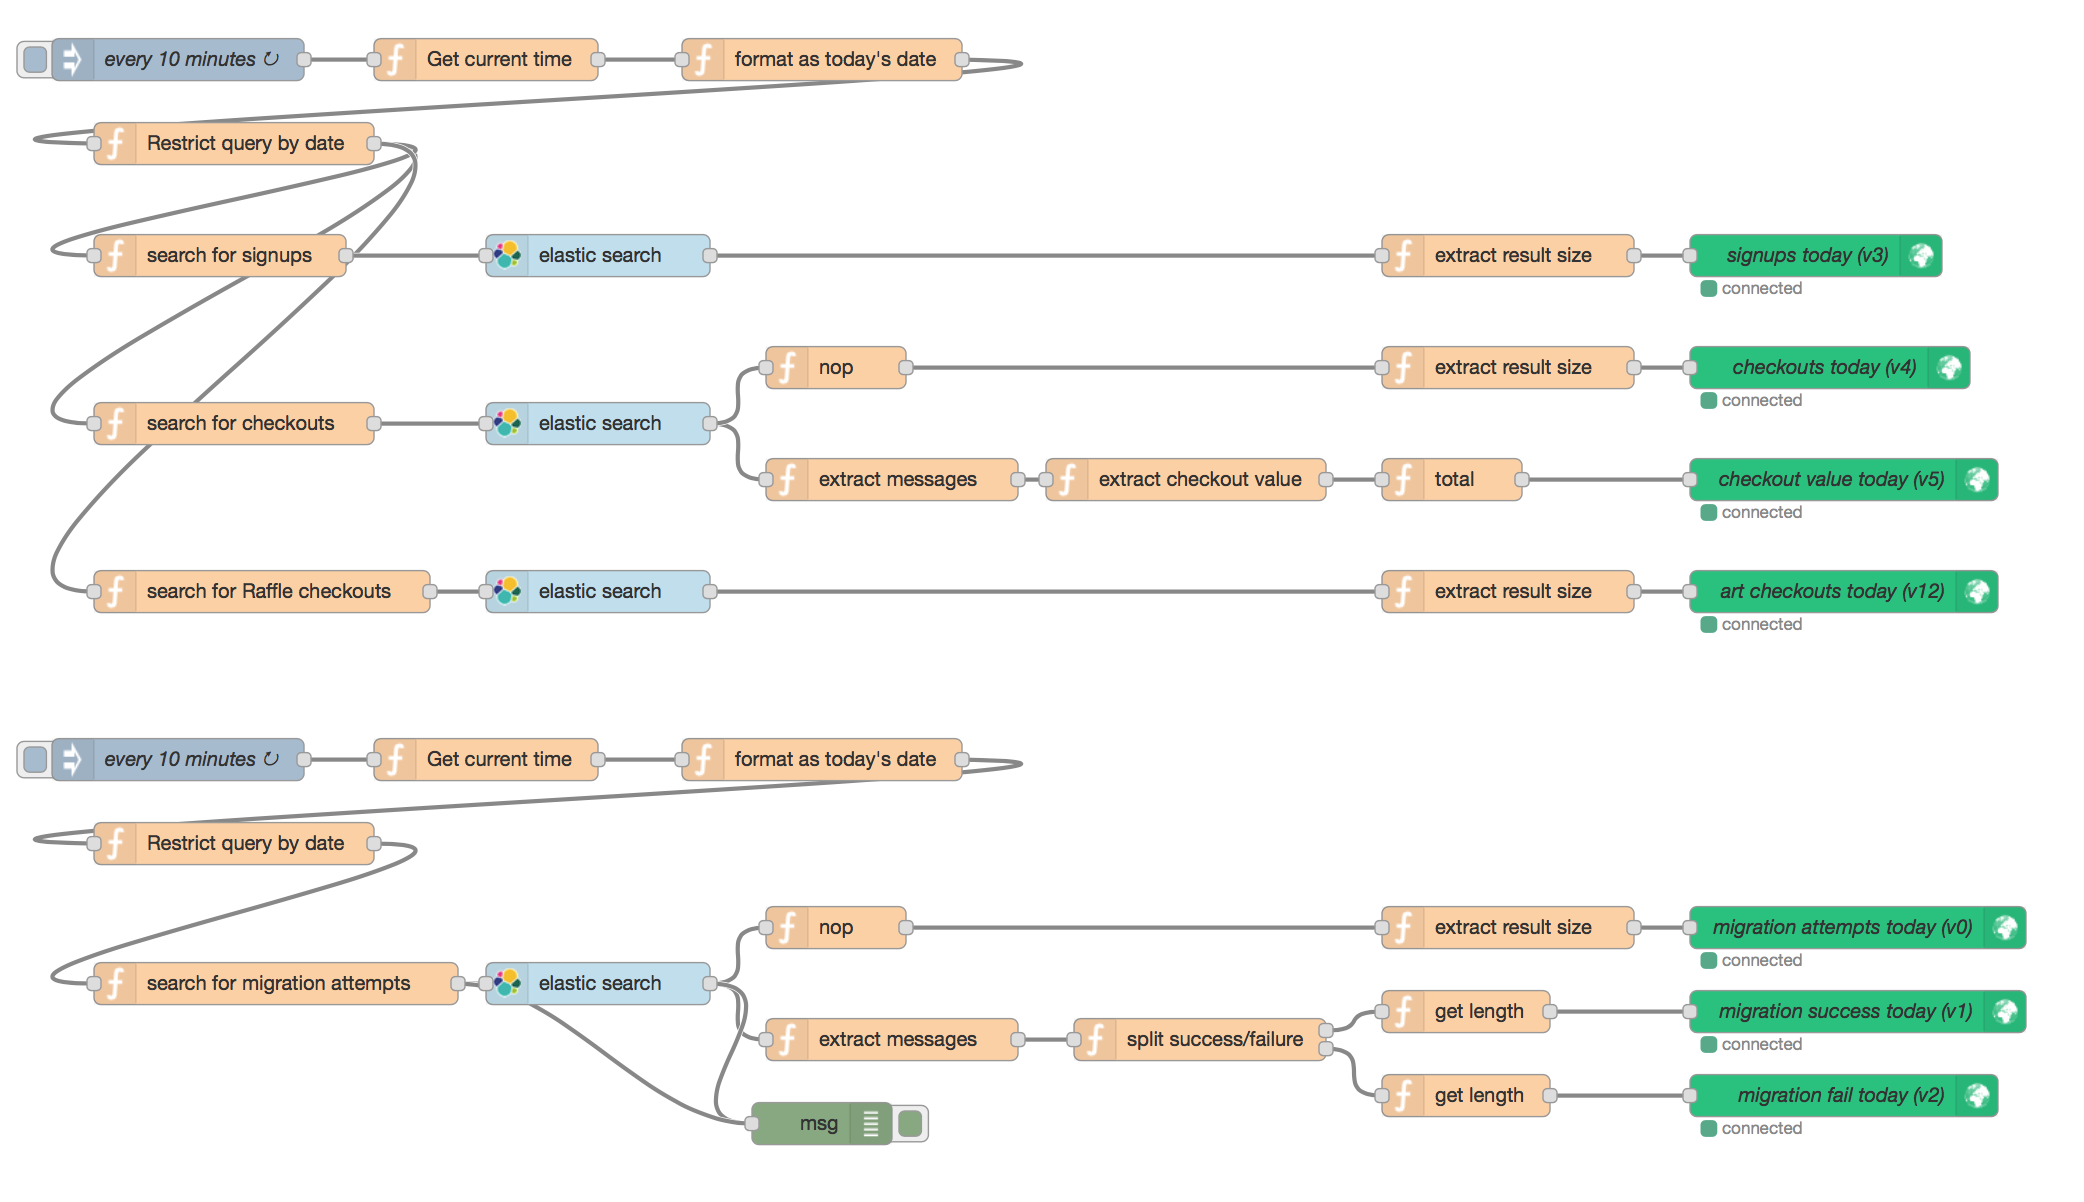] --- .left-column[ # Strategy ## Why ## Who ## What ## When # Tactics ## How ## Where ## With ] .right-column[ ## .red[Node-RED] - Nodes and Flows .fig40[ 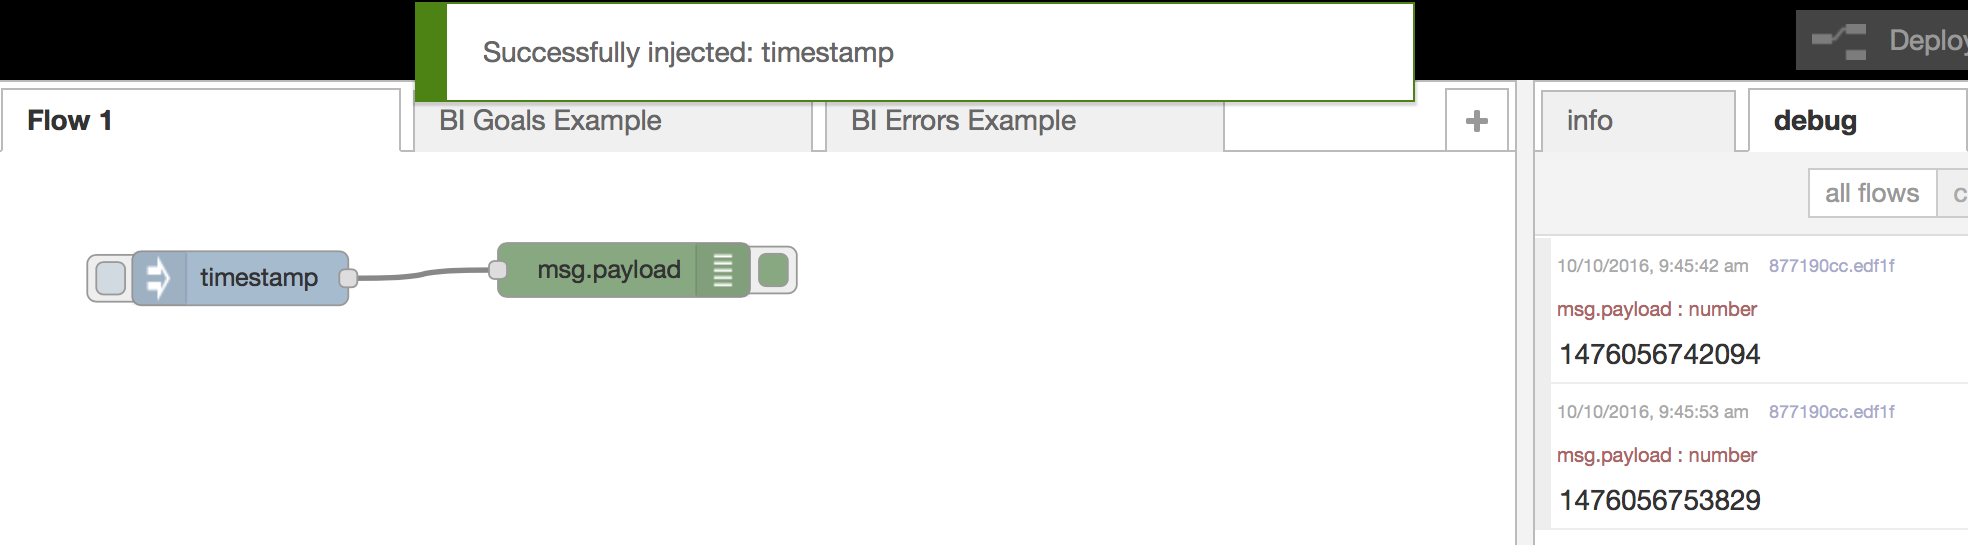] * The .blue[**coloured boxes**] are .red[**Nodes**] * Nodes are **npm** modules * Drag and drop nodes. Connect with links to form .green[**Flows**] * .green[**Flows**] persist as JSON data (`~/.node-red/flows.js`) * .green[**Flows**] process .purple[**Messages**] (JSON) * Over 750 node modules available * plus a general-purpose **function** node * or write-yer-own nodes ] --- .left-column[ # Strategy ## Why ## Who ## What ## When # Tactics ## How ## Where ## With ] .right-column.tight.small[ ## (ab)Using .red[Node-RED] for Business Dashboarding  * Search most SQL and NoSQL databases (eg. .yellow[**Elasticsearch**]) * Filter, Smooth, Report-by-Exception * Built in HTML .purple[**dashboard**] nodes (`node-red-dashboard`) * Push data to .green[**Blynk**] for iPhone/Android Apps .fig60l[ 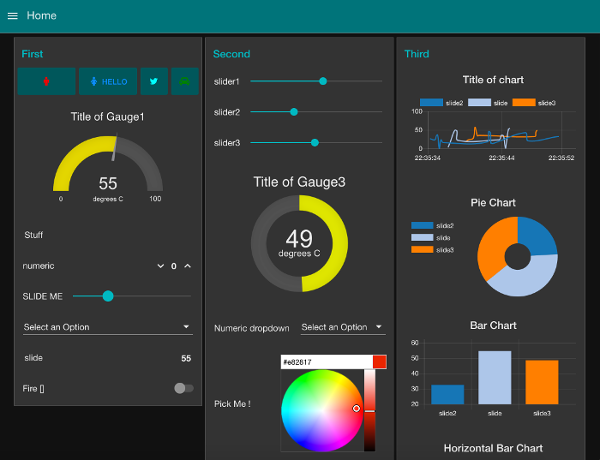] ] --- .left-column[ # Strategy ## Why ## Who ## What ## When # Tactics ## How ## Where ## With ] .right-column.small.tight[ ## Blynk - Agile dashboarding for one user or a thousand * .blue[blynk.cc] - cloud data, or self-host * interactive dashboard editor * share an app (with data) or clone (separate data) * free for ad-hoc sharing, pay for app-store distribution 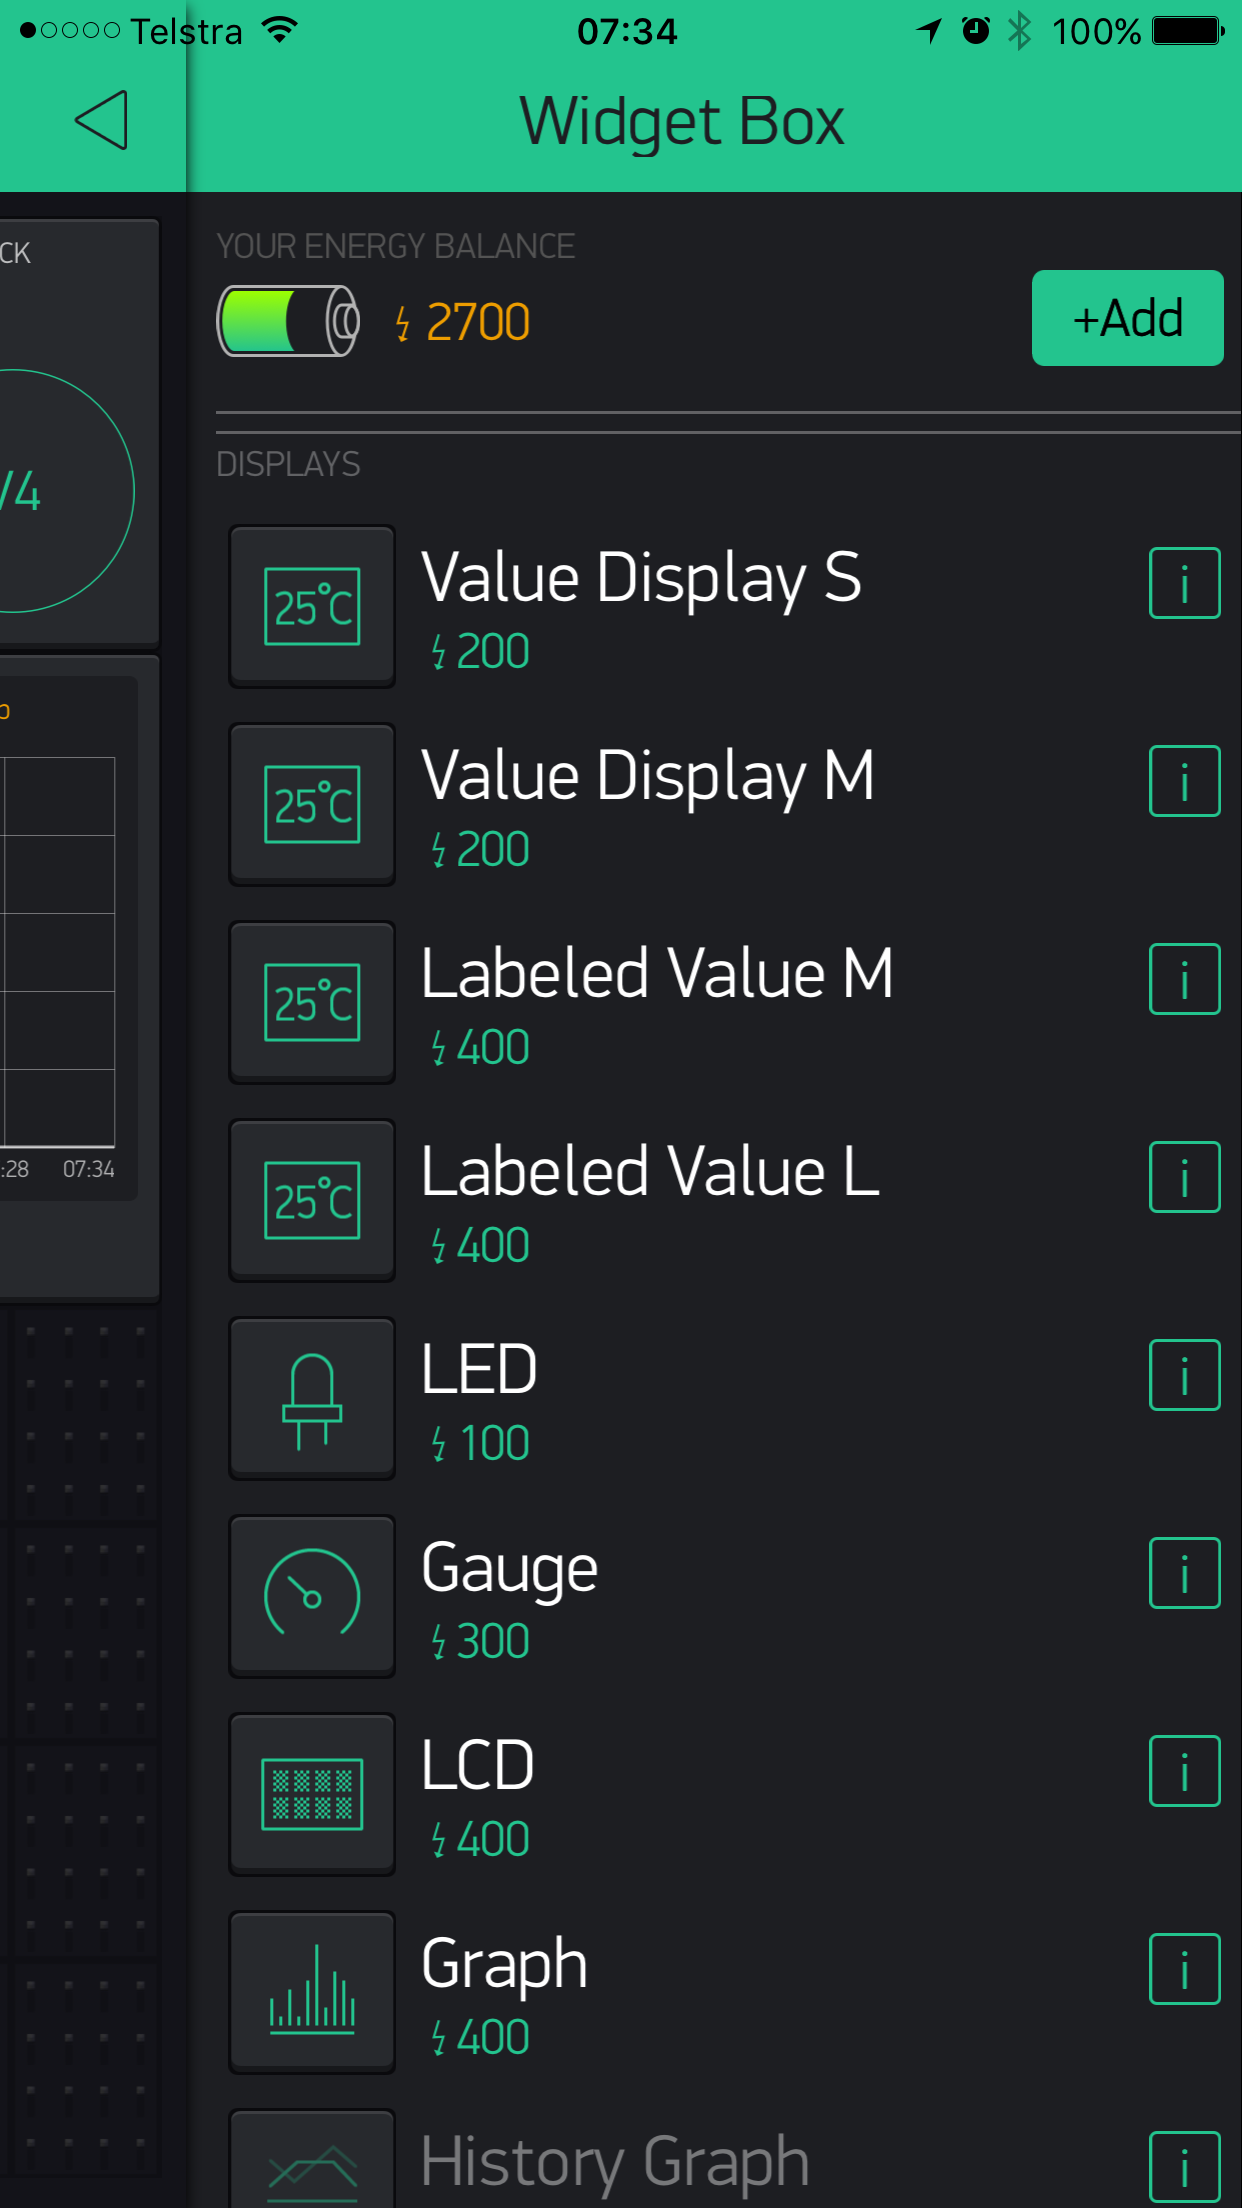 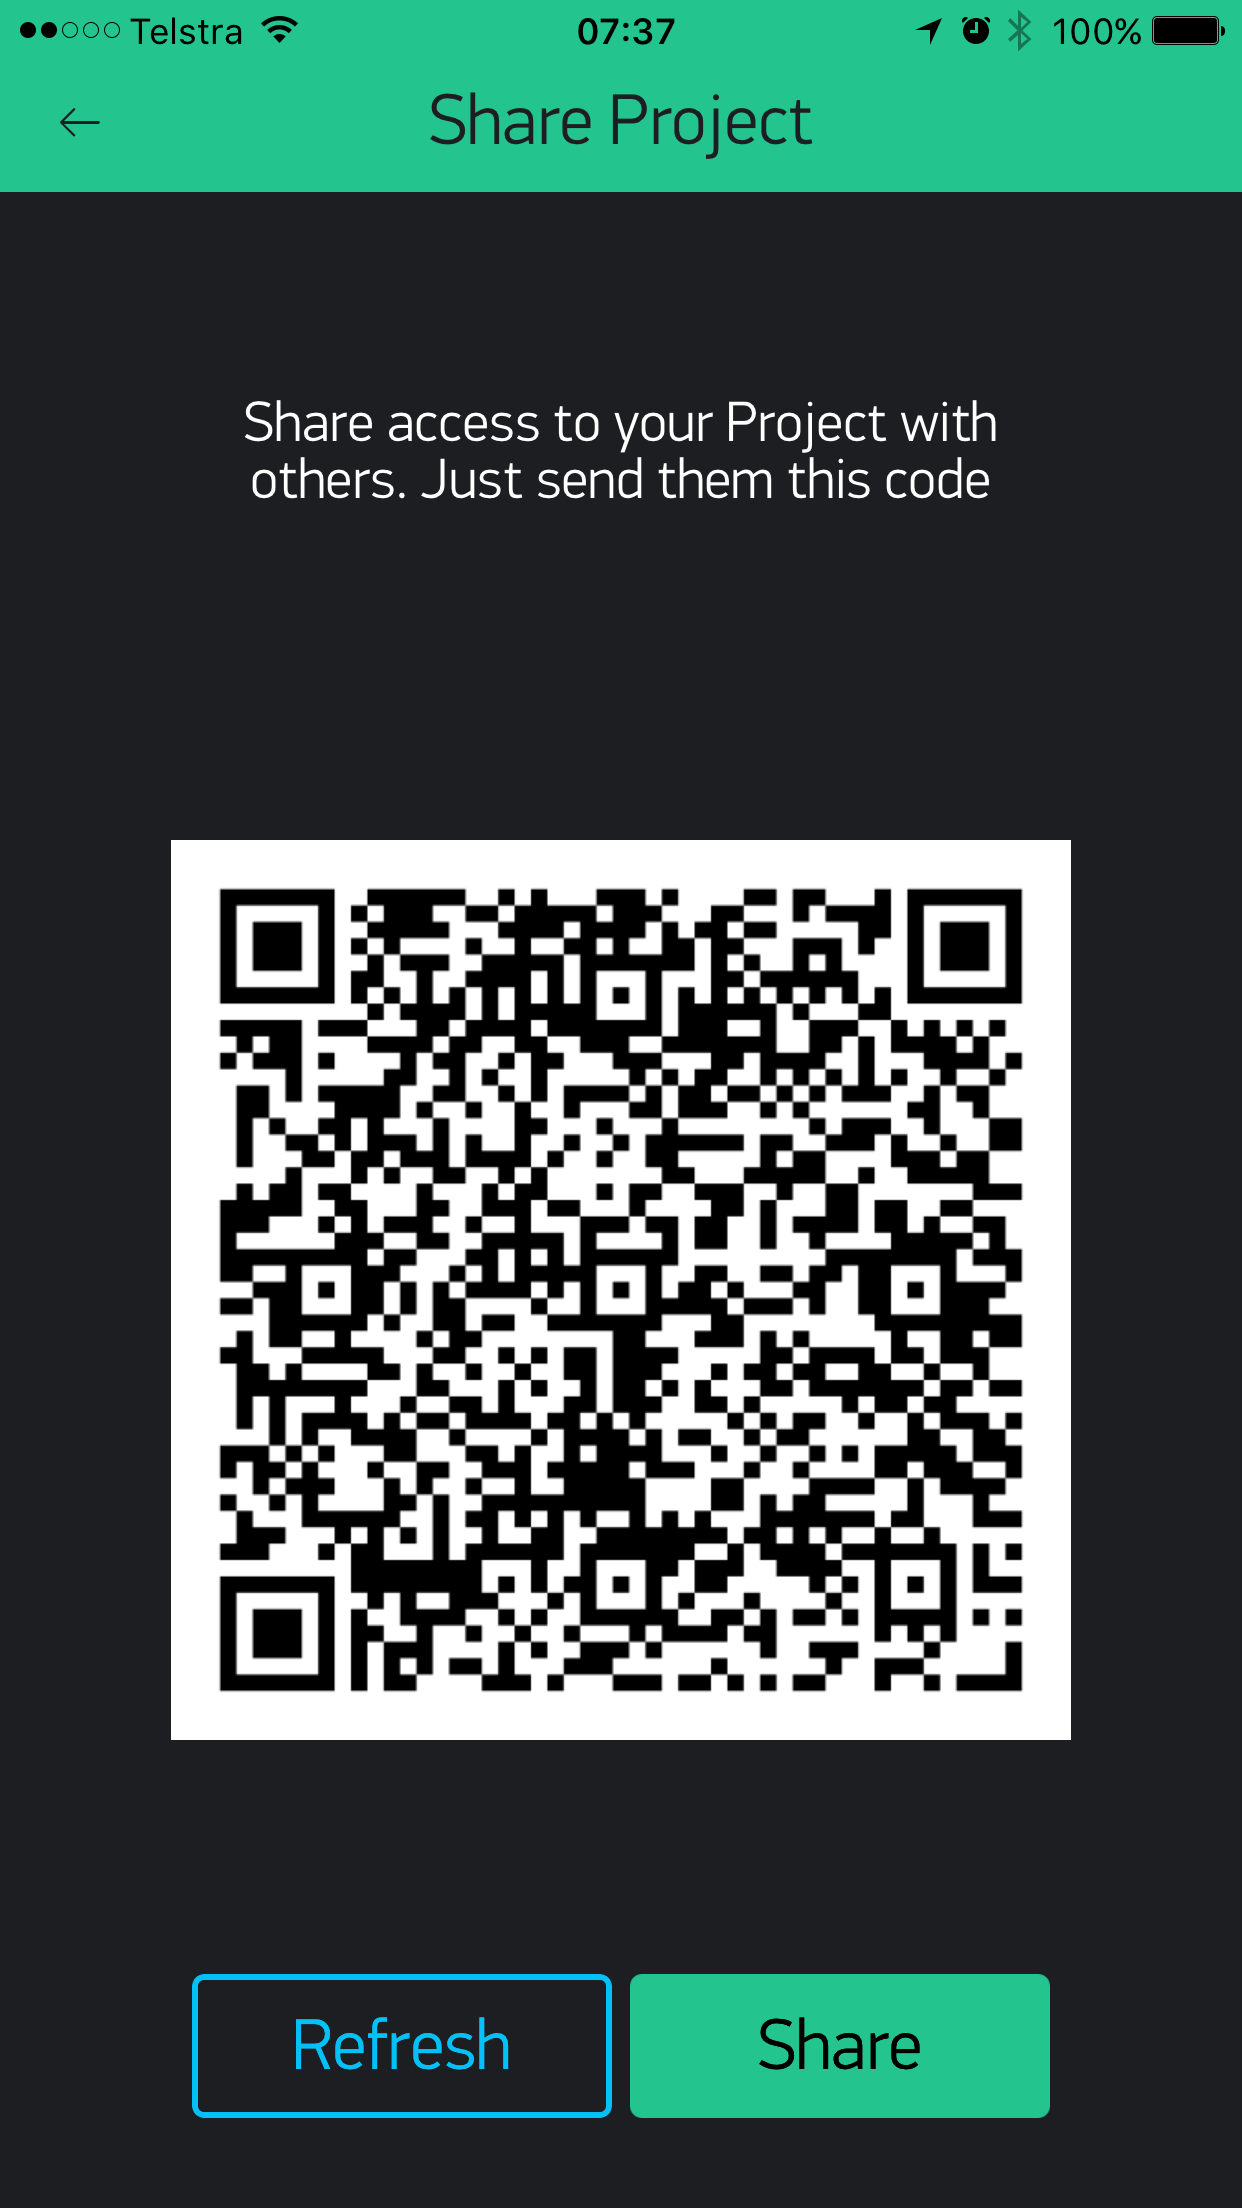 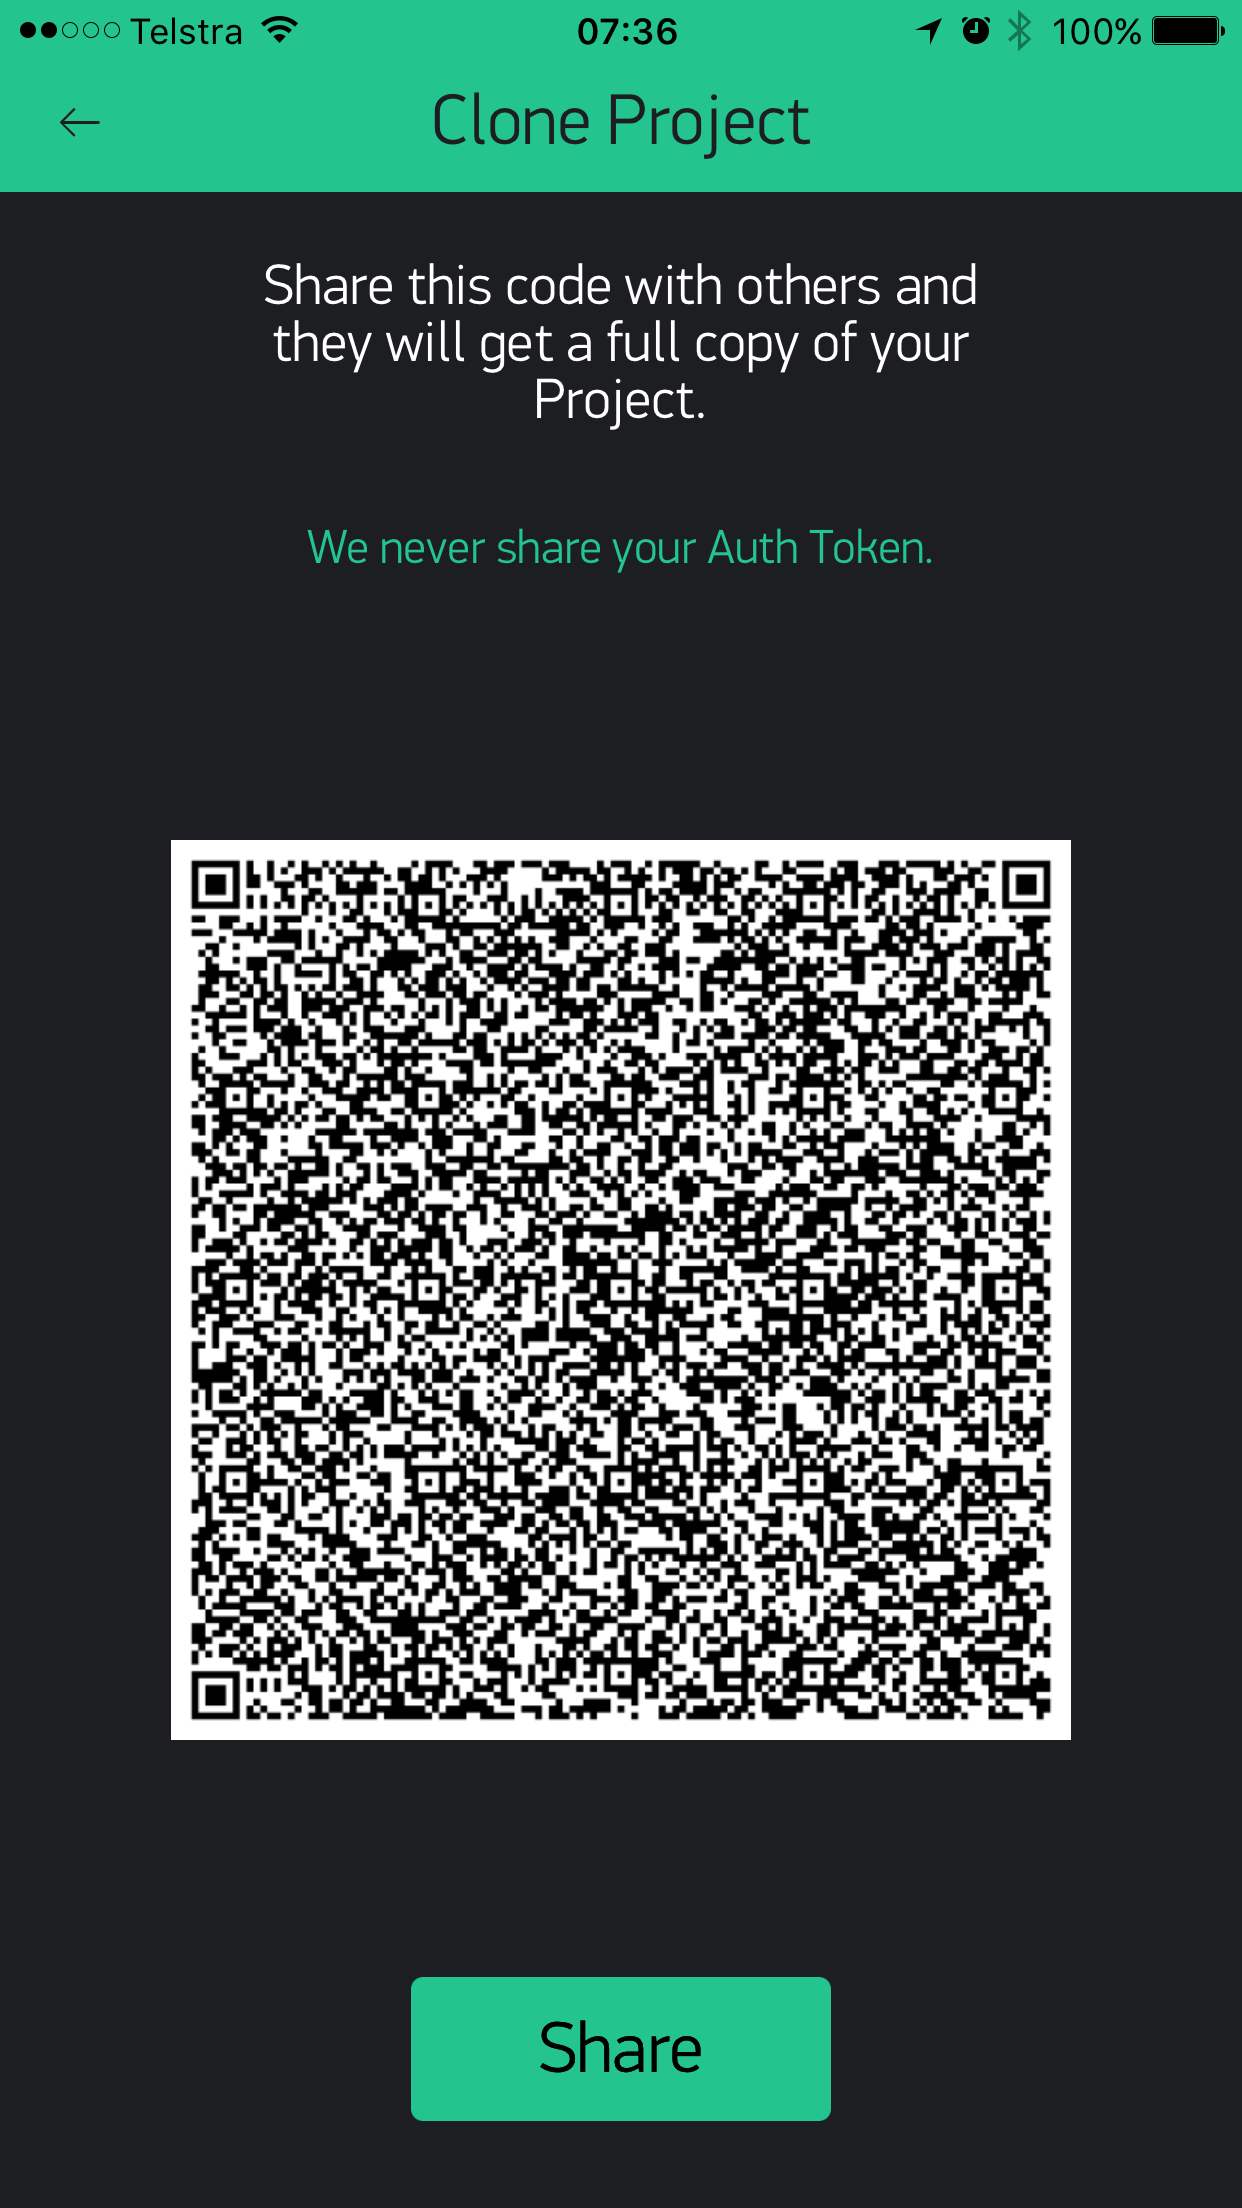 ] --- ## Server Error Monitor .fig60l[ 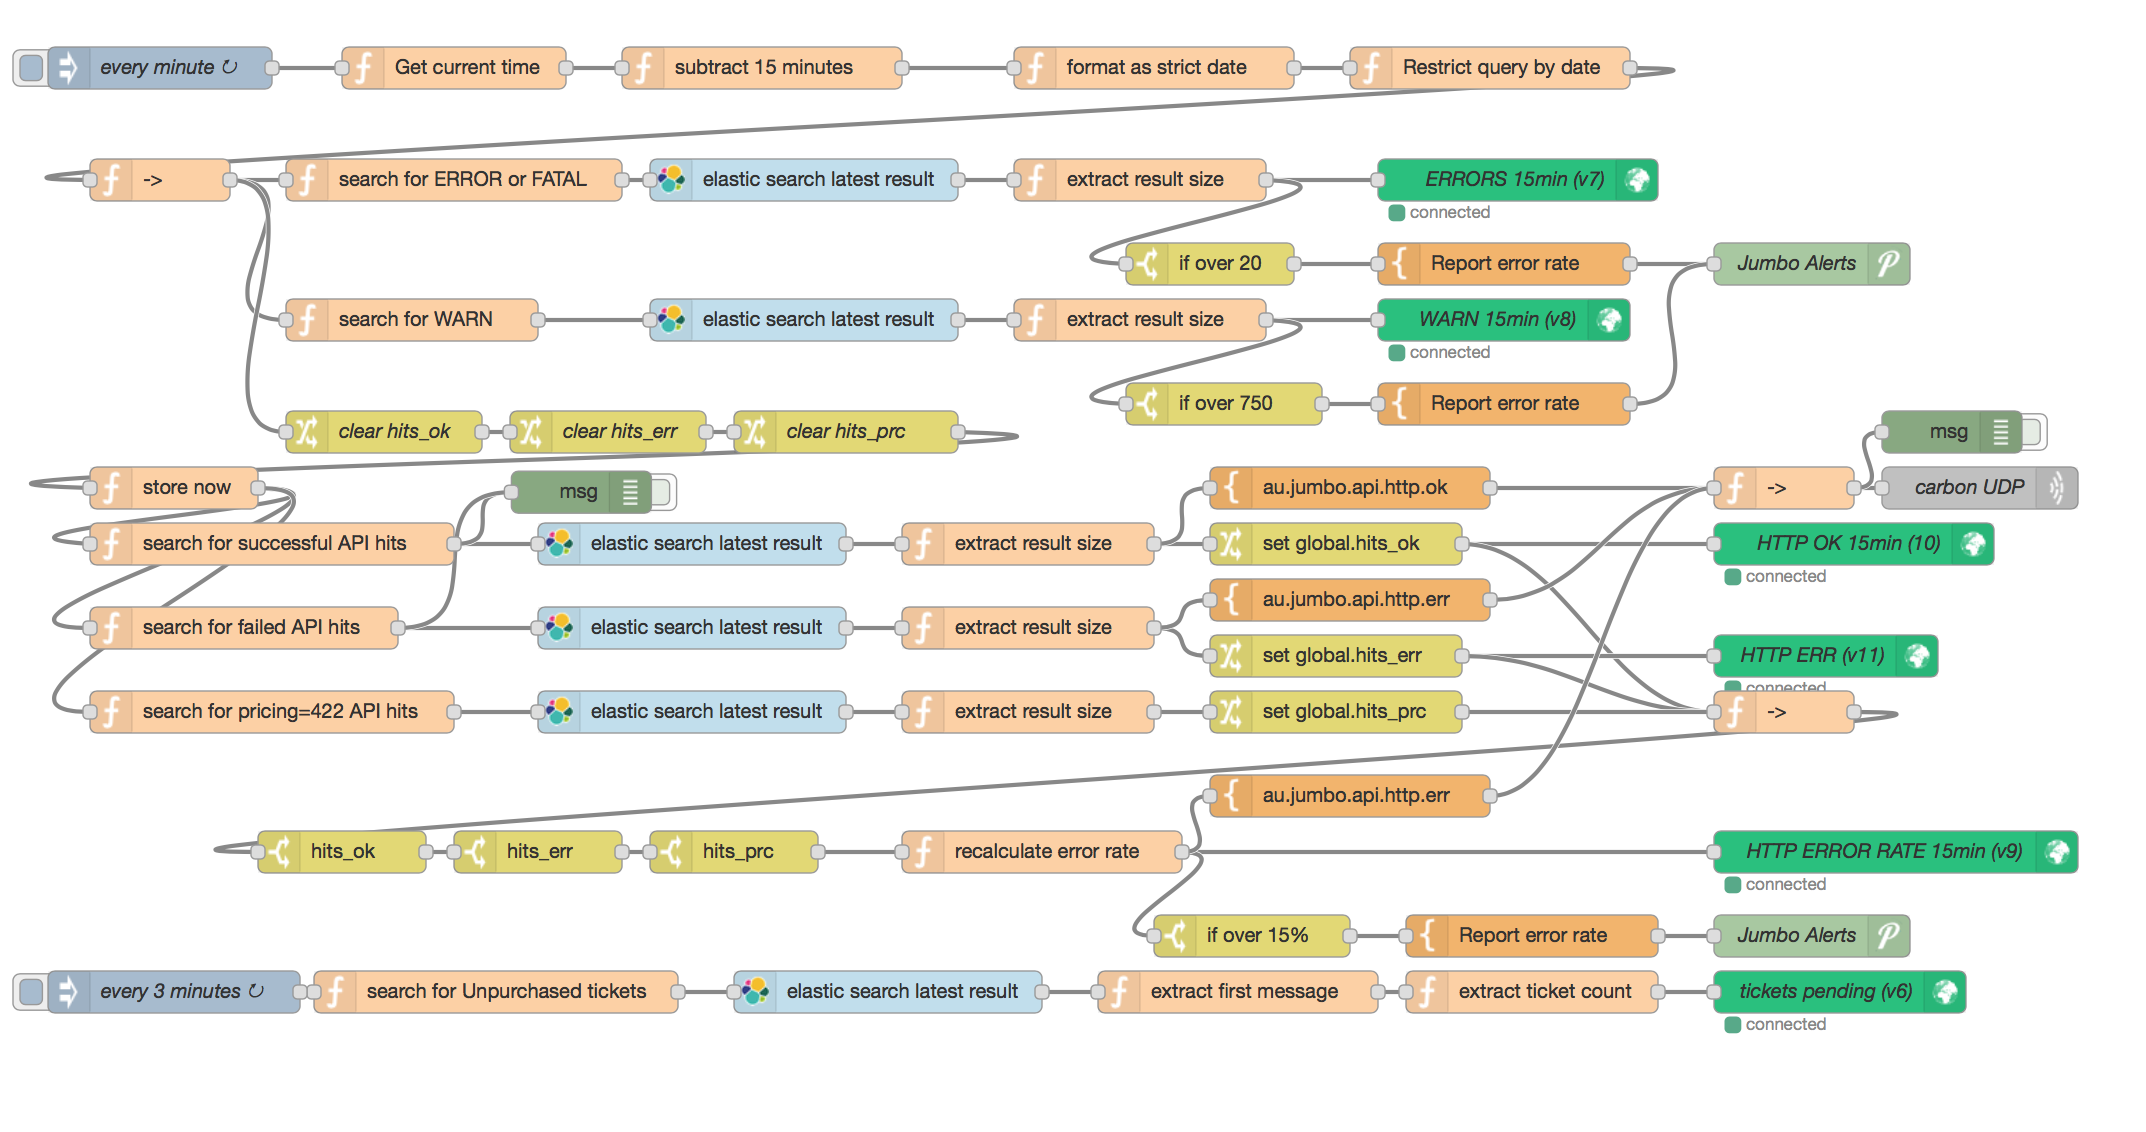] .fig30[ ] --- .left-column[ # Strategy ## Why ## Who ## What ## When # Tactics ## How ## Where ## With ] .right-column.vtight[ ## Social Media Integration .fig30[ ] * Receive feeds from twitter, facebook etc. * Recieve feeds from app stores * Post to slack, and monitor channels * Analyse, Summarise, Respond, Alert .fig60l[ ] ] --- .left-column[ # Strategy ## Why ## Who ## What ## When # Tactics ## How ## Where ## With # Coda ## Summary ] .right-column.bulletsh4[ ## Summary #### Target your dashboards, keep them focused #### You can do a lot more than just display graphs #### Design your dashboards early #### Be Agile: experiment, build, ship, iterate. #### Dashboards are code #### Bring all your data together for synergy ] --- .left-column[ # Strategy ## Why ## Who ## What ## When # Tactics ## How ## Where ## With # Coda ## Summary ## Resources ] .right-column.small.tight.bulletsh4[ ## Resources, Questions #### Source code * Docker configuration to run ELK and/or Node-RED in dev or CI * Example dashboards with data generators * [github.com/unixbigot/dashcon](https://github.com/unixbigot/dashcon) #### ELK - [elastic.co](https://elastic.co) #### Node-RED - [nodered.org](https://node-red.org/) #### Blynk - [blynk.cc](https://blynk.cc/) #### Me - Christopher Biggs - Twitter: .blue[@unixbigot] - Email: .blue[christopher@biggs.id.au] - Slides, and getting my advice: http://christopher.biggs.id.au/ - Accelerando Consulting - IoT, DevOps, Big Data - https://accelerando.com.au/ ]